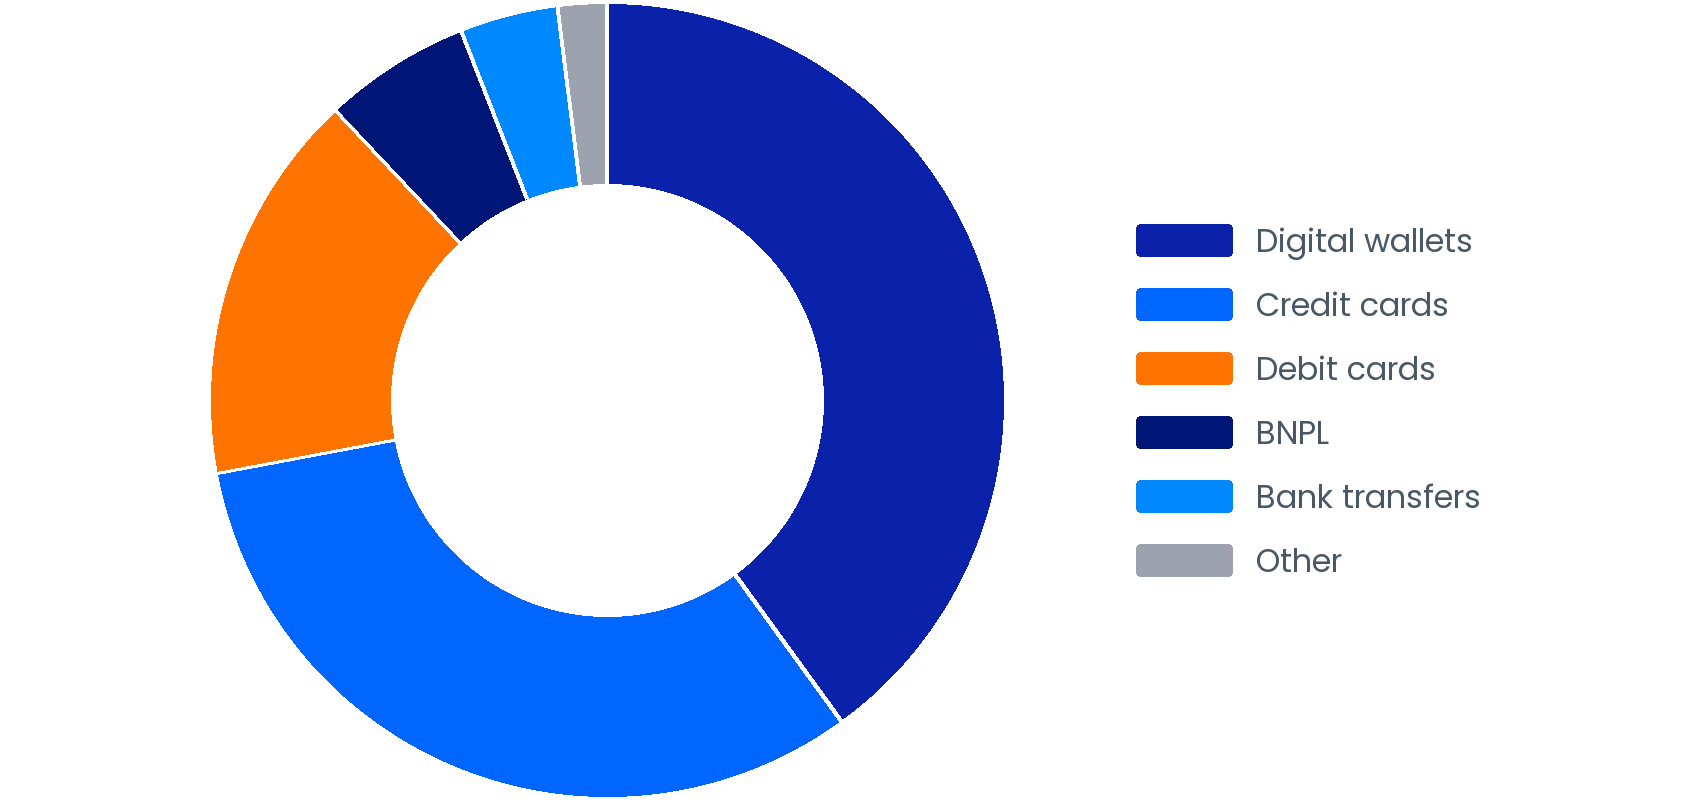
The United States had an estimated 262 million digital payment users in 2025, with a reported penetration rate of 76.38%. Digital wallets lead online transaction value at 40%, followed by credit cards at 32% and debit cards at 16%.
United States overview
Country | United States |
|---|---|
Population | 341.8 million |
GDP (USD) | $30,620 billion |
Currency | United States Dollar (USD) |
Digital payment user penetration | 76.38% (2025) |
Digital payment CAGR (2025–2029) | 21.66% |
Which Payment Methods Do US Buyers Use Most?
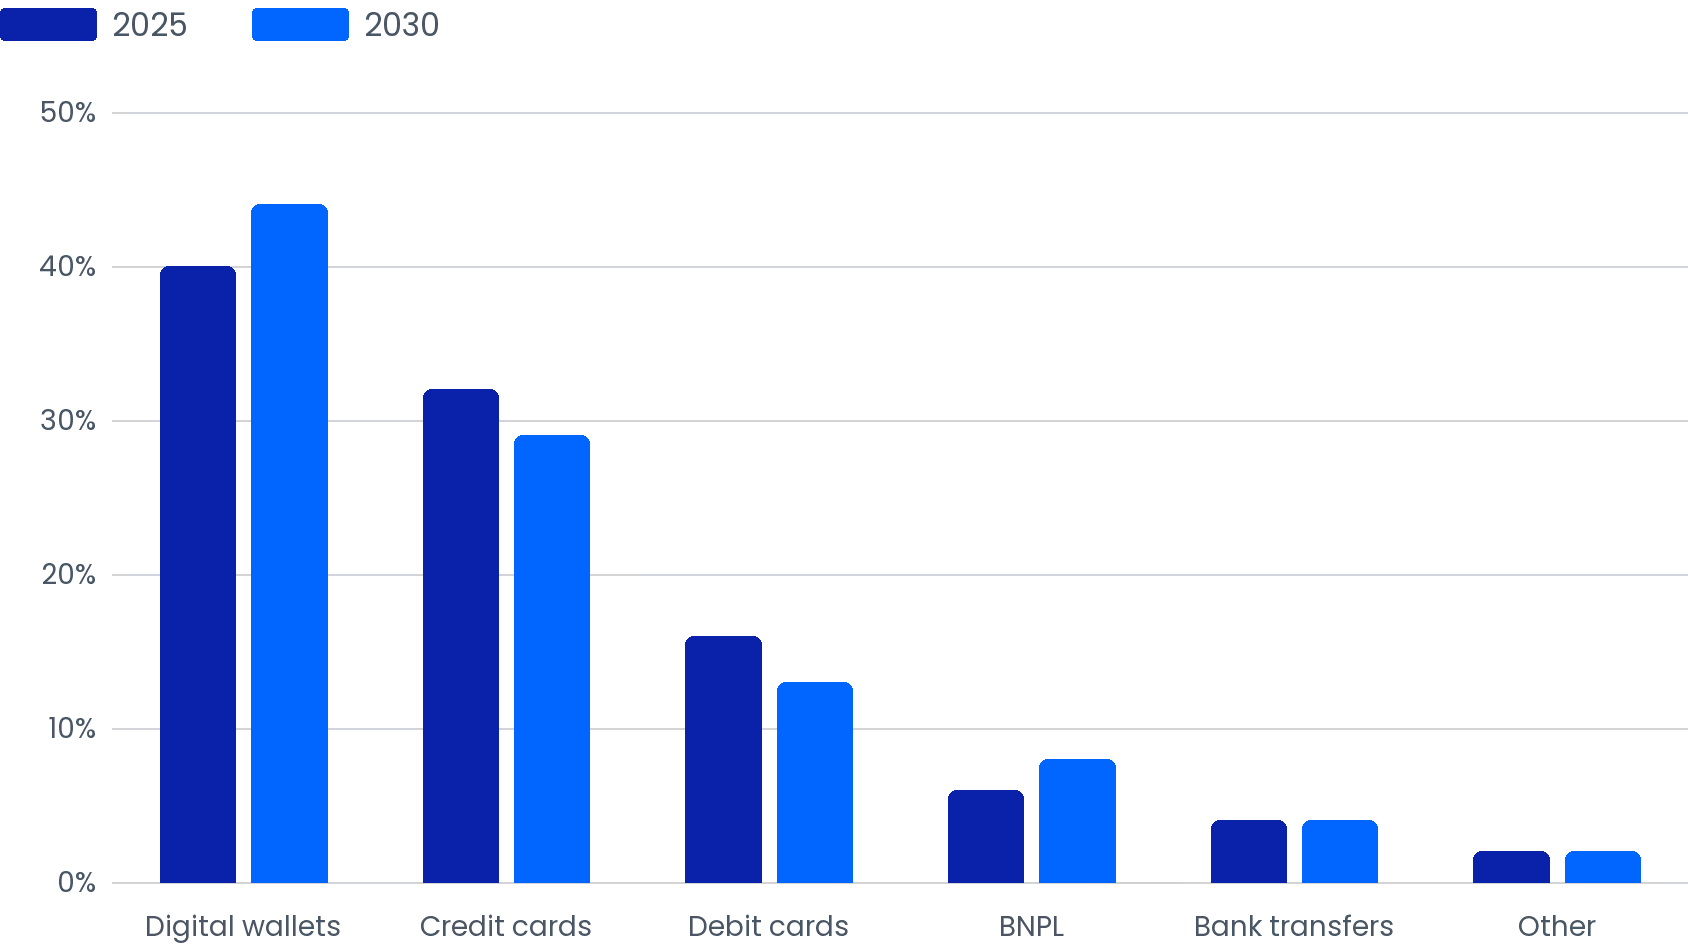
Digital wallets lead US e-commerce at 40% in 2025, followed by credit cards at 32% and debit cards at 16%. BNPL (Buy Now, Pay Later) holds a 6% share, while the US BNPL market is forecast to grow at a 13% CAGR over the next five years. Together, wallets and credit cards cover approximately 72% of US online transaction volume. US's 2025 payment breakdown:
- Digital wallets — 40%, growing to 44% by 2030. Apple Pay and Google Wallet dominate through card-binding logic that eliminates manual card entry. Offering wallet payment reduces friction on mobile and measurably lifts conversion.
- Credit cards — 32%, projected 29% by 2030. Visa leads brand share, with Mastercard closely behind. A significant and growing portion of credit card spend flows through wallet rails rather than raw card-number entry.
- Debit cards — 16%, projected 13% by 2030. Declining as wallets absorb volume. Banks are accelerating this shift through initiatives like Paze, which strengthens digital card-binding at the bank level.
- BNPL — 6% in 2025, projected to reach an 8% share by 2030. The US BNPL market is forecast to grow at a 13% CAGR over the next five years, supported by providers such as Affirm and Klarna and by retailer installment programs. BNPL can raise average order value (AOV) by converting purchase hesitation into deferred payment commitment for higher-ticket items.
- Bank transfers — 4%, stable through 2030. ACH credit and ACH debit are common US bank-payment formats. Processing and merchant-funds availability depend on the payment setup and provider.
United States Payment Method Share (2025)
How Digital Wallets, Credit Cards, and ACH Work for Merchants in the US
The US payment stack combines wallets, cards, BNPL, and bank payments. Consumer protections, card-network procedures, and provider dispute processes can overlap, so merchants should follow the deadlines supplied for each case. Visa has replaced VDMP with the broader Visa Acquirer Monitoring Program. Merchants should confirm the current requirements with their acquirer. The failed payments guide covers general recovery practices.
Payment Method | Key Platforms | Approx. Share | What Merchants Should Know |
|---|---|---|---|
Digital wallets | Apple Pay, Google Wallet | ~40% | Wallet checkout bypasses manual card entry — reducing declined transactions from incorrect card numbers; test card-binding flows before launch. |
Credit cards | Visa, Mastercard | ~32% | A growing share of credit card spend flows through wallet rails (via Paze and bank digital services) rather than direct card-number entry — monitor wallet-sourced card authorization rates separately. |
Debit cards | Visa Debit, Mastercard Debit | ~16% | Regulation E provides error-resolution rights for covered electronic fund transfers; applicable card-network or provider procedures may also matter. |
BNPL | Affirm, Klarna | ~6% | The provider may assume consumer credit-repayment risk, but merchants can still be responsible for purchase disputes. Under Affirm's US dispute process, a merchant may have to reimburse a customer refund and pay a fee when the customer prevails. |
Bank transfers | ACH and bank-account payments | ~4% | ACH debit allows an authorized merchant-initiated pull; ACH credit is initiated by the payer. Timing and fees depend on the product and provider. |
How the US Payment Mix Will Shift by 2030
Digital wallets grow from 40% to 44% by 2030. Credit cards decline from 32% to 29%; debit cards from 16% to 13% as card credentials migrate into wallet layers via Apple Pay, Google Wallet, and Paze. BNPL grows from 6% to 8%. For subscription merchants evaluating ACH debit alongside cards, the involuntary churn guide covers payment-recovery practices.
United States Payment Method Share: 2025 vs 2030 Projection